Monitoring System Activity
Activities: Introduction
Many computers have components in their hardware to show the activity of disk drives and network interfaces by small displays, e.g. LEDs. Macintosh computers don’t have such lights for design reasons. Many users miss these flickering signs of life of their computer, however. Such lights can also help to identify and locate technical problems, e.g. a failing hard drive or an undesirably communicating network program. System Monitor can retrofit such activity lights by software.

If you like to monitor activity of your computer, perform the following steps:
- Ensure the control window of System Monitor is open.
- Select the item Information Sources > Activities in the sidebar.
- Make sure the check mark Monitor this item is set at the right side of the window.
Only those disks and interfaces will be shown which you have selected for monitoring (see below).
The data shown is calculated live and updated about four times per second.
Activities: Menu Bar
The menu bar is the element used for the visual display of activity. Different from the other monitor sections, the respective part of the menu bar will configure itself automatically. The following items will be presented:
- The vertical label HD if the activity of hard drives is being monitored.
- An icon representing activity of the first selected hard drive.
- If available, additional icons representing the second, third, etc. selected hard drive.
- The vertical label NET if the activity of network interfaces is being monitored.
- An icon representing activity of the first selected network interface.
- If available, additional icons representing the second, third, etc. selected network interface.
Activity is shown by simple graphical symbols which perfectly match the black-and-white design of the menu bar. If desired, you can alternatively enable the use of color for each individual symbol (see below). For network interfaces, a different presentation is alternatively available which can be enabled by the option Use up/down icons for network activity. This alternative mode more reflects the metaphor of “uploading” and “downloading”. The icons have the following meaning:
| Black-and-White | Colored | Meaning |
|---|---|---|
 |
 |
no activity |
 |
 |
receiving/reading data |
 |
 |
sending/writing data |
 |
 |
sleep mode (standby) |
 |
 |
offline mode |
 |
 |
alternative presentation of network activity: receiving/“downloading” data |
 |
 |
alternative presentation of network activity: sending/“uploading” data |
Activities: Menu Items
For each activity icon, the menu displays a reminder which device is associated with which icon position. The individual disks and interfaces are listed in the established sort order, following the pattern HD 1, HD 2, …, NET 1, NET 2, ….
Selecting the Objects to Monitor
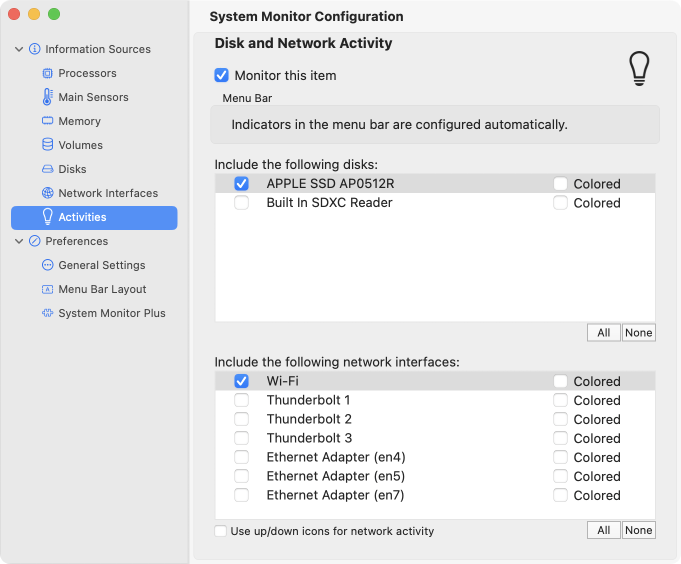
The tables Include the following disks and Include the following network interfaces allow you to control which objects should be monitored by the app and which shouldn’t. Set a check mark next to each item which should be monitored and remove the check marks for items where no monitoring should be performed. The selection can also be applied to all entries automatically, using the buttons All or None. The lines in the tables can be dragged to a different sort order if desired. This order will then be used for the corresponding icons in the menu bar. By checking the fields Colored, you can determine whether a black-and-white or color icon should be used.
Please note that the individual items represent physical hardware parts of the computer. So for disk drives, it doesn’t play a role whether they contain readable volumes. For network ports, it doesn’t play a role whether they are currently active, i.e. attached to a cable and associated with a communication address. Ethernet ports that have been combined to a single network interface via dynamic link aggregation (IEEE 802.3ad) are still represented as multiple objects.
Additional menu items
Most users place the monitoring item Activities to the leftmost position, which is the location where normal Macintosh menus have the items to administer the running program. For this reason, the item Activities additionally contains the features
- About System Monitor to open the information window and
- Quit System Monitor to shut down the running program.